A risk assessment matrix is a grid that combines two judgements — how likely a hazard is to cause harm, and how serious that harm would be — to produce a single risk score. The 5x5 version is the most common in UK workplaces, but 3x3 and 4x4 versions exist and have their place. This page covers how the standard matrix works, what each axis means, how to score it consistently, and the limitations every assessor should know about before relying on the result.
The matrix is a tool, not a method. It's part of step three of the risk assessment process — the evaluation step — and supports decisions about which hazards need urgent action and which can wait. It doesn't replace the judgement that good assessment depends on, and it isn't legally required. The Management of Health and Safety at Work Regulations 1999 require a "suitable and sufficient" assessment; they don't prescribe how the scoring should be done.
Why use a matrix at all
Three reasons. Consistency — once an organisation agrees what each likelihood and severity level means, two different assessors will produce comparable scores for similar hazards. Without a matrix, the same hazard can be rated "minor" by one manager and "serious" by another. Communication — a numeric score and a colour band tell readers very quickly which items in the assessment need action and which can be monitored. Prioritisation — when a workplace has dozens or hundreds of identified hazards, the matrix gives a defensible basis for deciding what to fix first.
The thing the matrix is not good at is producing a precise estimate of harm. We'll come back to that.
The 5x5 matrix
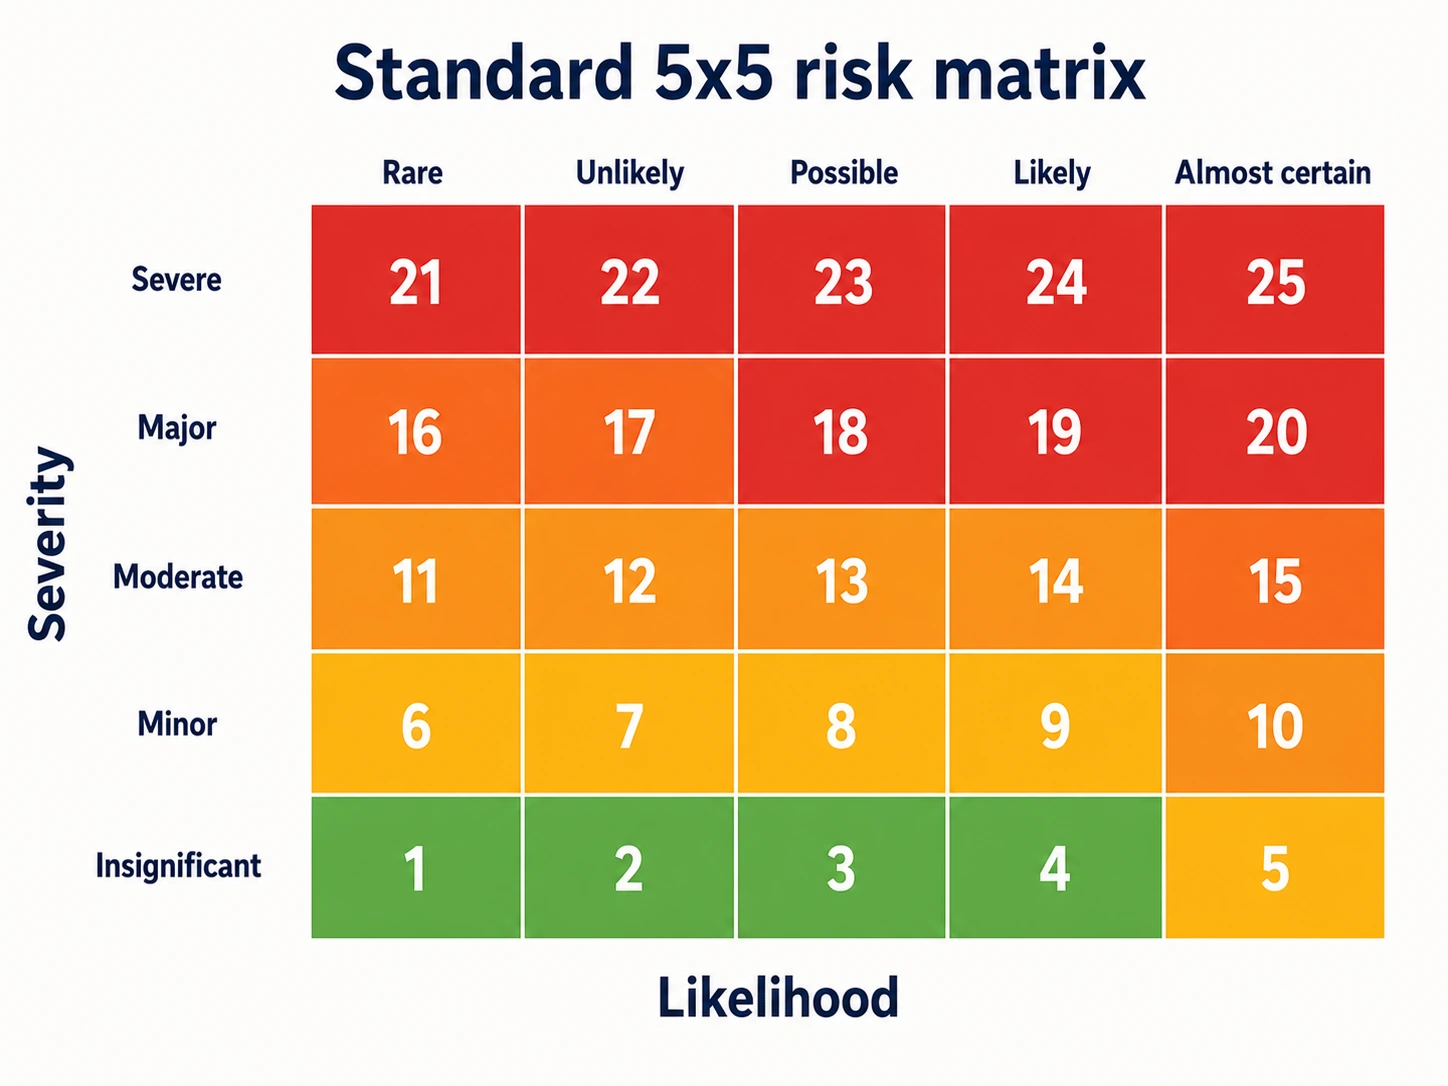
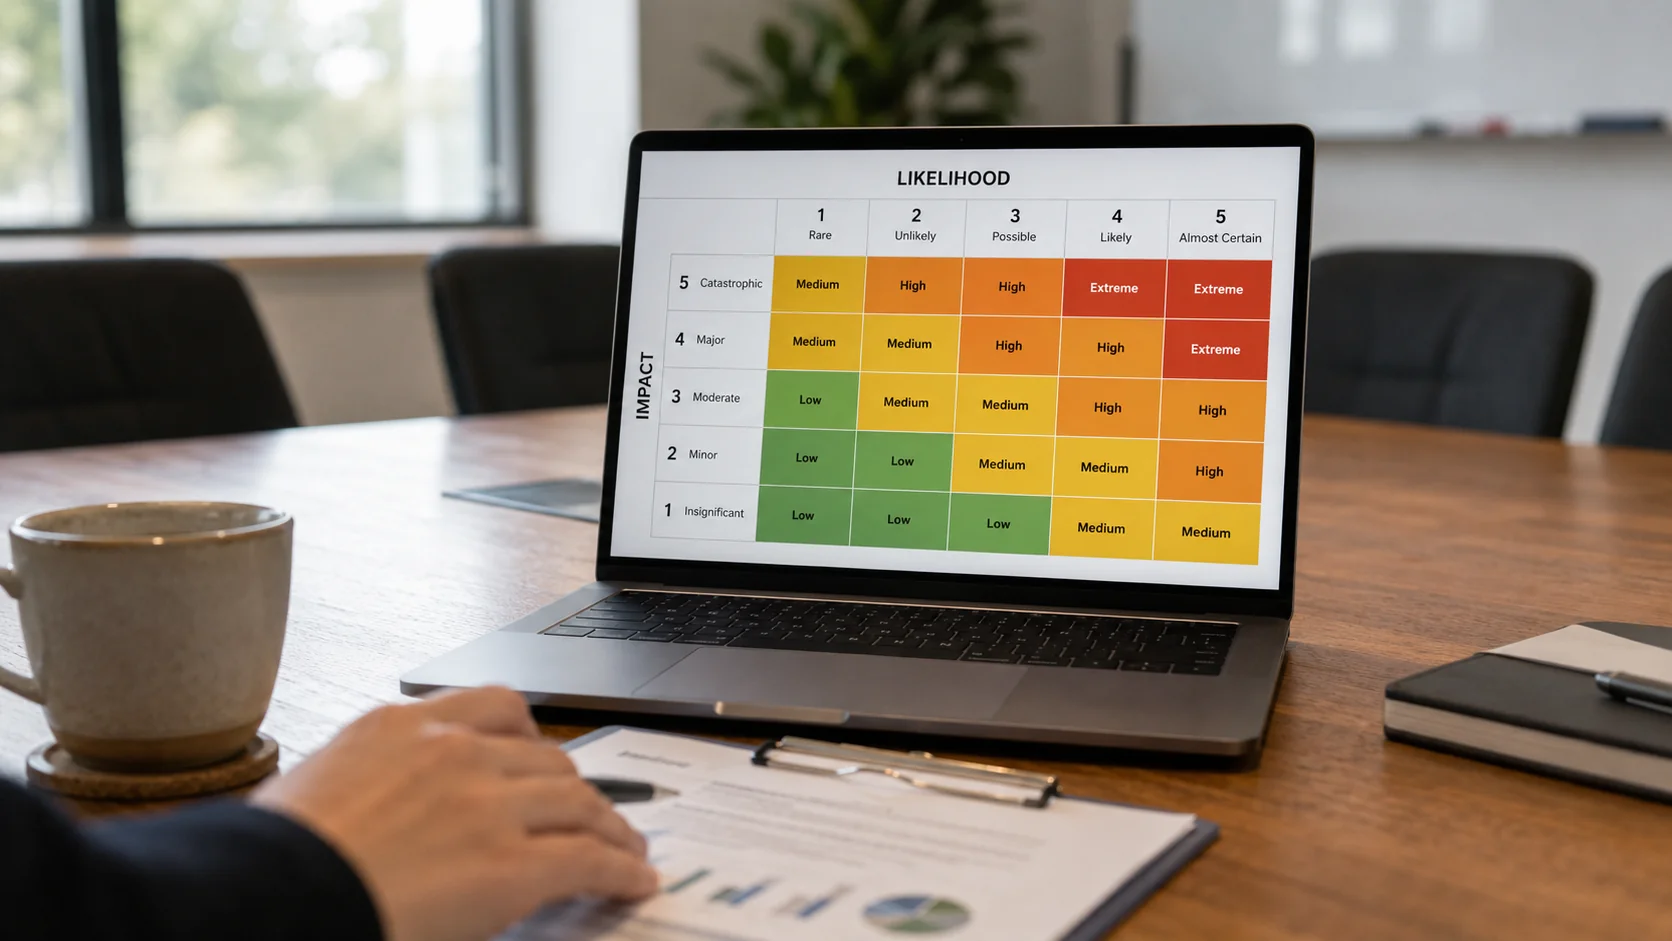
The standard UK matrix has likelihood on one axis (usually horizontal) and severity on the other (usually vertical). Each axis has five levels. Multiply the two scores and you get a risk rating between 1 and 25. The output is usually colour-coded — green for low, amber or yellow for medium, red for high — to make the priority obvious.
The matrix has 25 cells. Each cell represents a combination of one likelihood level and one severity level, and is assigned a score (the product of the two) and a category. Most matrices group the scores into bands: 1–4 low, 5–9 medium, 10–16 high, 17–25 critical. The exact thresholds vary between organisations, but the principle is the same.
Defining the likelihood axis
The labels on the likelihood axis are less important than what they mean in practice. Common UK conventions use five levels with names like Rare, Unlikely, Possible, Likely, and Almost Certain — but the names matter less than the descriptions an organisation attaches to them.
Rare (1)
The hazard could cause harm only in exceptional circumstances. Reasonable controls are already in place. You wouldn't expect this to happen in the working lifetime of the equipment or process.
Unlikely (2)
Conceivable but not expected. Most controls are effective. Realistically, you might see this happen once in many years.
Possible (3)
The hazard could cause harm under normal conditions if the controls fail. You might expect this to happen occasionally — perhaps once a year — across a workforce or fleet.
Likely (4)
Expected to happen unless additional controls are put in place. Existing controls are partial. Could be expected to occur multiple times a year.
Almost Certain (5)
Effectively no controls, or controls are known to be failing. Could happen at any time. May already be happening.
The trick to consistent scoring is to anchor the levels in real frequency or probability — actual time periods or actual exposure rates — rather than just feel. "Once a year across this site" gives a more consistent answer than "unlikely" on its own.
Defining the severity axis
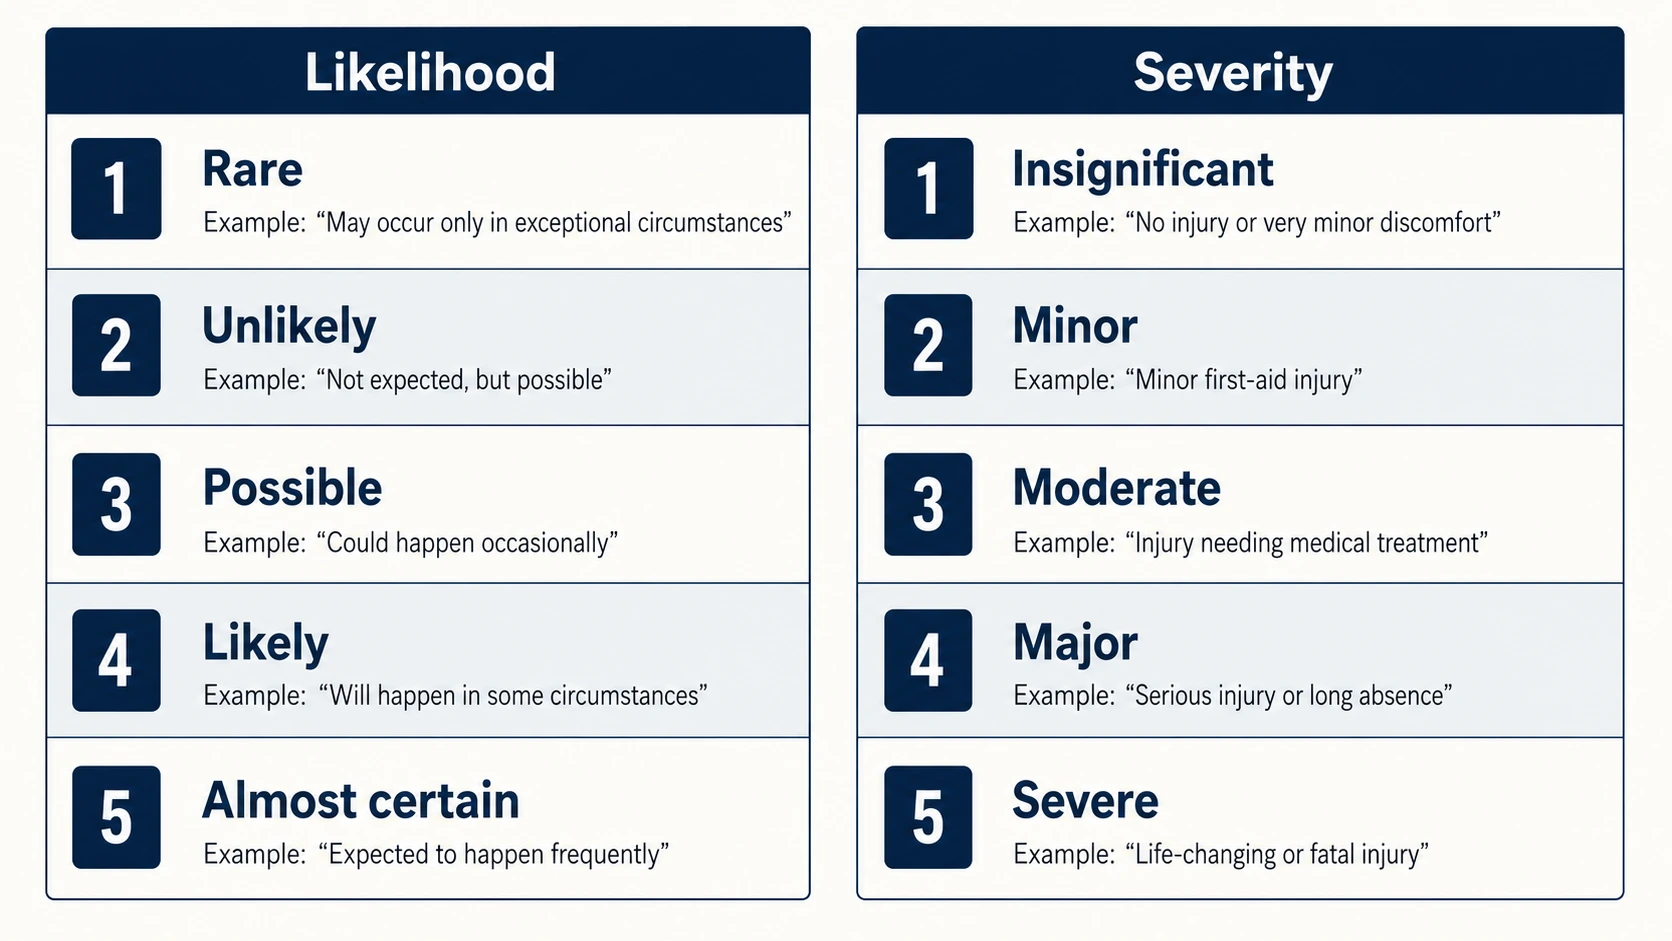
The severity axis describes how bad the harm would be if it occurred. For health and safety, the levels usually map to injury severity outcomes.
Insignificant (1)
No injury, or first-aid level only. No lost time. A minor cut treated with a plaster.
Minor (2)
Injury requiring more than first aid but no lasting effect. Sprained wrist, mild cut needing stitches, a day off work.
Moderate (3)
Significant injury with temporary effect. Broken bone, hospital admission, time off lasting weeks. RIDDOR-reportable in many cases.
Major (4)
Serious injury with lasting effect. Permanent disability, multiple fractures, hospital stay of seven days or more, RIDDOR-reportable.
Severe (5)
Fatal injury, permanent and life-changing disability, or harm to multiple people simultaneously.
For non-injury harm — health damage, occupational disease, mental ill-health — the same five levels apply but the outcomes look different. A short period of work-related stress might score 2. A persistent musculoskeletal disorder that ends a career might score 4. A fatal asbestos-related disease scores 5 even though the harm appears decades after exposure.
Calculating and reading the score
The arithmetic is simple. Likelihood × Severity. A possible (3) chance of a major (4) injury scores 12. A rare (1) chance of a severe (5) outcome scores 5.
Most UK matrices use four bands:
Low (typically 1–4): green
Acceptable. Maintain existing controls and monitor periodically. Move on.
Medium (typically 5–9): amber
Further controls should be considered. Where the score sits in the upper part of the band — say 8 or 9 — the controls usually need action soon. At the lower end of the band — 5 or 6 — periodic review may be sufficient.
High (typically 10–16): red or upper red
Controls are inadequate. Specific further action is needed. Work may need to be paused or modified until controls are improved.
Critical (17–25): red
Stop the activity. Significant remediation needed before work resumes.
The boundaries between bands are conventions, not laws of nature. Some organisations use three bands, some five. Some treat severity 5 as automatically requiring red-band controls regardless of likelihood. The convention you choose matters less than applying it consistently across the organisation.
When to use 3x3 or 4x4 instead
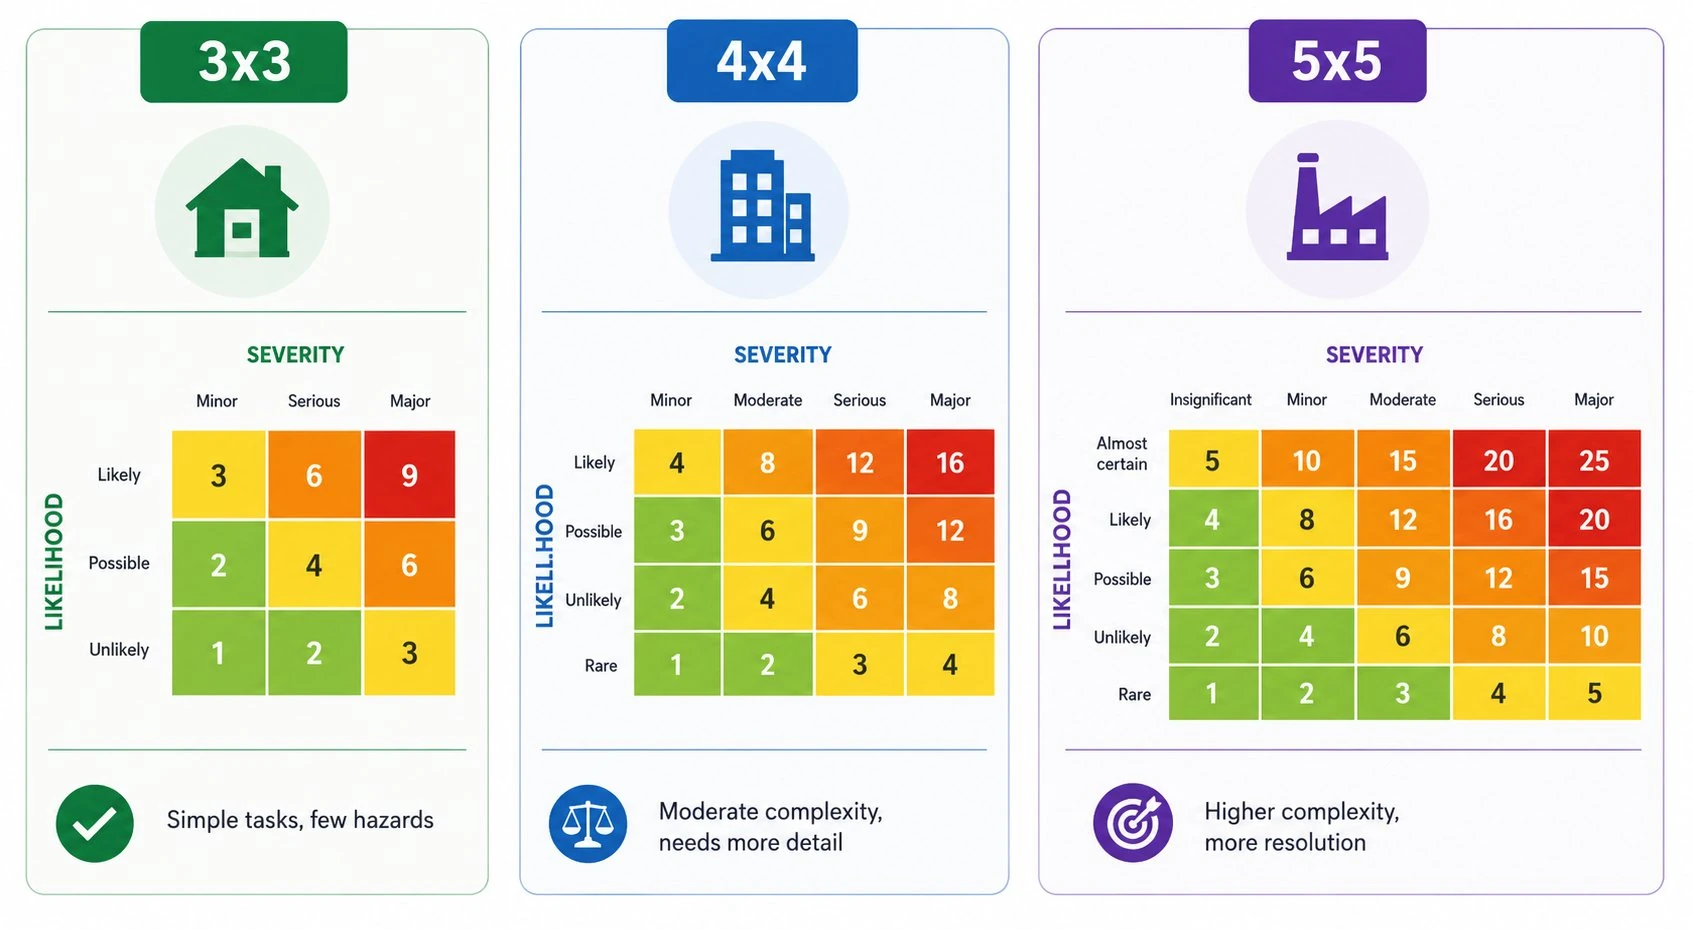
For very simple operations, a 3x3 matrix is often more honest about the precision of the underlying judgements. Three likelihood levels (Unlikely, Possible, Likely) and three severity levels (Minor, Serious, Major) produce a 9-cell grid that's easier to use, harder to overcomplicate, and just as useful for low-complexity workplaces.
A 4x4 sits in between, with four severity levels that are sometimes easier to distinguish than five.
The 5x5 is the standard because it offers enough resolution to distinguish meaningfully between hazards in mid-sized and larger workplaces, without becoming so granular that scoring becomes a long internal debate. For most UK workplaces, the 5x5 is a sensible default and the one we use in our worked risk assessment examples.
The limitations every assessor should know about
The matrix has real limitations. Knowing them is part of using it responsibly.
Subjectivity, dressed as precision
Likelihood and severity are estimates. Multiplying two estimates produces a number with one decimal of apparent precision, but the underlying judgements weren't that precise. A score of 12 looks like it contains useful information; in reality it's saying "amber-to-red, requires action soon". Don't treat the number as more accurate than the inputs.
Range compression
The 25-point scale clusters most real workplace hazards into a narrow band. Trivial hazards score 1–3; serious ones score 12–20; truly catastrophic but rare hazards may score 5 (rare × severe) and end up in the same green band as something genuinely trivial. The colour bands matter more than the absolute scores, and even the bands can mislead at the edges.
The medium-band trap
Hazards that land in the amber band tend to stay in the amber band because they're "tolerable" without being urgent. Years pass, the action column shows the same outstanding item, and the matrix has effectively endorsed inaction. Good assessors revisit amber items deliberately rather than accepting them as the steady state.
Hidden assumptions about controls
The likelihood score reflects whatever controls are already in place. If a worker says "we tape the floor up properly so slipping is unlikely", the score might be 2 — but only as long as the floor actually gets taped. The matrix doesn't capture the fragility of the controls; the assessment narrative has to.
Mathematical objections
Tony Cox's 2008 paper "What's Wrong with Risk Matrices?" in Risk Analysis set out a series of formal critiques — including the observation that matrices can rank hazards in the wrong order under certain conditions. The academic critique is real. For practical workplace assessment it doesn't invalidate the tool, but it's a reminder that the matrix is a heuristic, not a calculation.
None of this means the matrix is useless. It means it should be used as a prompt for judgement rather than a substitute for it.
A worked example
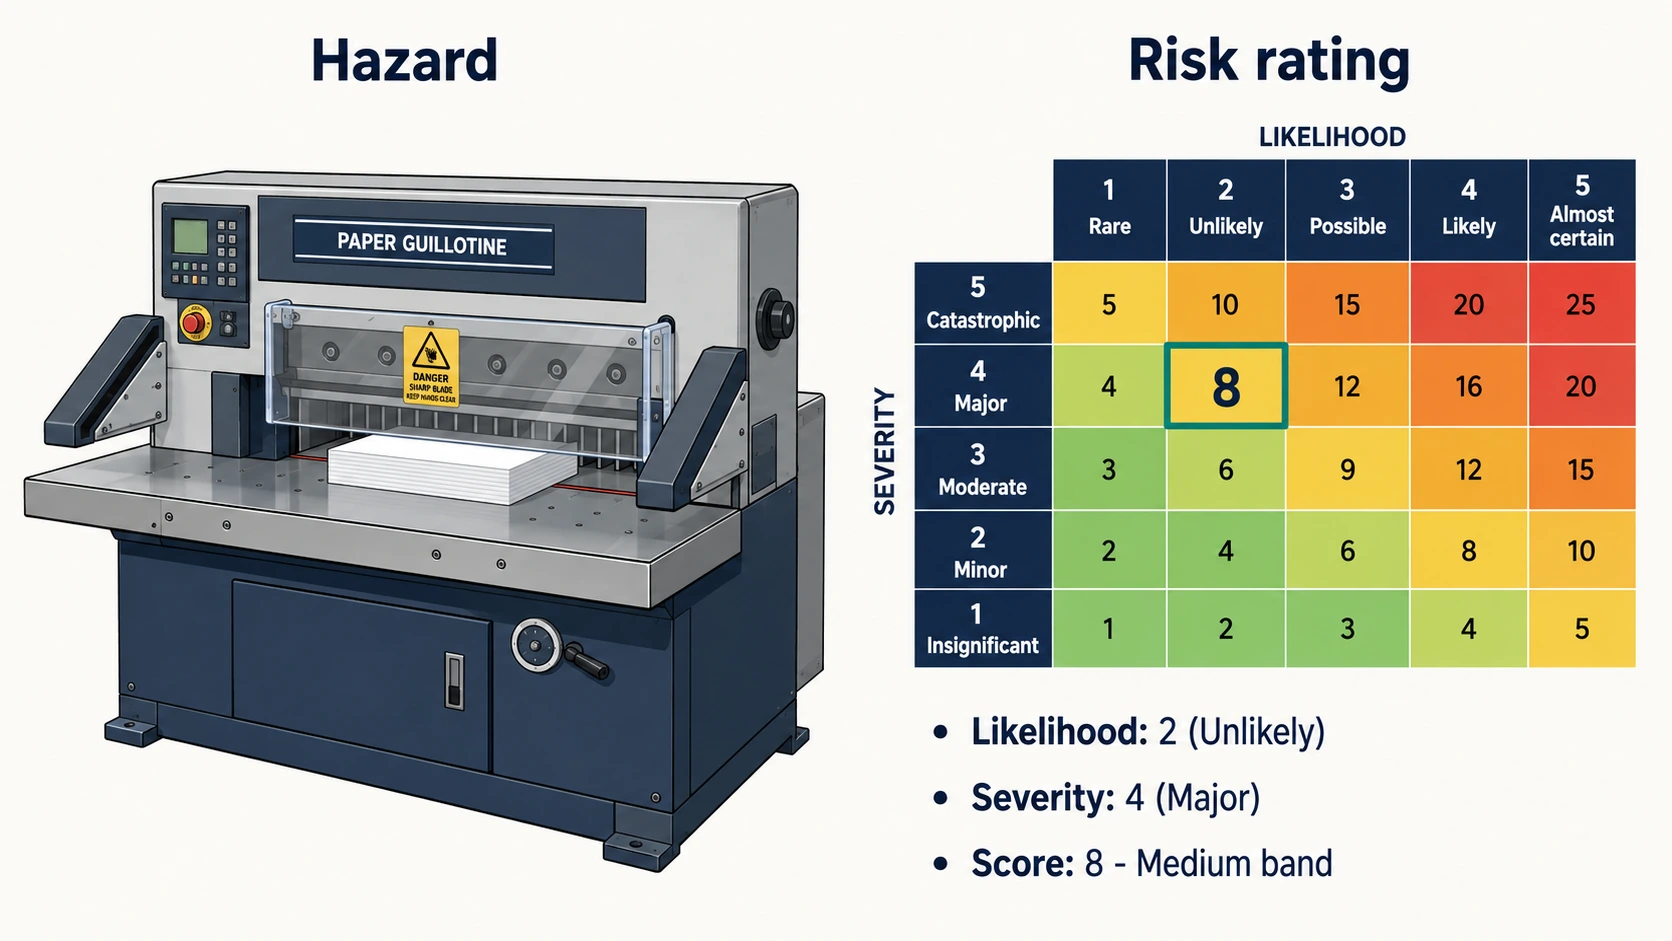
A small printing workshop assesses the risk of a worker being injured by the cutting blade on a guillotine that's used daily.
The likelihood depends on what controls are in place. The guillotine has a two-hand operating system that requires both hands on the controls before the blade descends, a guard over the blade path, and a clear maintenance regime. Workers are trained and there have been no incidents. Likelihood: unlikely (2).
The severity if it did go wrong is significant. The blade could cause severe lacerations or amputation. Severity: major (4).
Risk score: 2 × 4 = 8. Medium band, upper end.
The assessor records the controls and the score, and notes that the next review will check the maintenance log, observe the operator using the equipment, and verify that the training records are up to date. The score doesn't drop below 8 unless the engineering controls themselves improve, which would cost more than the residual risk justifies.
That's a defensible outcome. The matrix didn't make the decision; it gave the assessor a framework for documenting why the existing controls were sensible and what would need to change for the score to move.
Where the matrix fits in the wider method
The matrix is one input to the five-step risk assessment process. It sits inside step three (evaluate the risks and decide on precautions) and supports the prioritisation of any further actions identified in step four (record findings and implement). It doesn't replace the hierarchy of control — even a low-scored hazard might justify engineering controls if the engineering is cheap and reliable, and a high-scored hazard isn't dispatched just by adding PPE.
For complex or technical assessments — especially those covered by specific regulations like COSHH, the Manual Handling Operations Regulations or the Regulatory Reform (Fire Safety) Order 2005 — the matrix sits alongside the regulation-specific tools rather than replacing them.
If you're carrying out assessments routinely and your matrix conventions aren't yet documented, that's worth fixing. The single biggest improvement we see in organisations is when likelihood and severity get anchored in concrete, organisation-specific descriptions rather than generic adjectives. The investment shows up in better consistency between assessors and better defensibility when something goes wrong. Formal Risk Assessment Training covers both the matrix itself and the underlying method.
Frequently asked questions
Is a 5x5 risk matrix legally required in the UK?
No. The Management of Health and Safety at Work Regulations 1999 require a suitable and sufficient assessment of risk but don't specify a particular scoring method. The 5x5 matrix is widely used because it's reasonably consistent and easy to communicate, not because the law mandates it.
What's the difference between likelihood and severity?
Likelihood is how probable it is that the hazard will actually cause harm, given the controls already in place. Severity is how bad the harm would be if it did occur. Both are estimates; multiplying them gives the risk score.
Can I use a 3x3 matrix instead?
Yes. A 3x3 matrix is often a better fit for simple operations because it doesn't pretend to more precision than the underlying judgements can support. Some HSE-published example assessments use a simplified risk rating rather than a numerical matrix at all.
Do I have to use the same matrix conventions across the whole organisation?
Not legally, but it's strongly recommended. Different scoring conventions on different sites mean that the same hazard could rank differently in different reports, which makes prioritisation across the organisation harder and exposes inconsistencies in any inspection.
What are the main limitations of a risk matrix?
The big four are subjectivity in scoring, range compression that pushes most hazards into a narrow band, the tendency for medium-band items to stay medium-band indefinitely, and the matrix's blindness to how fragile the controls behind the likelihood estimate actually are. The matrix is a prompt for judgement; it's not a calculation of harm.
Related guides
- The 5 steps of risk assessment explained
- Risk assessment examples: three worked examples for UK workplaces
- Who can carry out a risk assessment? The competence question explained
Make sure your team can score and act on workplace risks with confidence.
Explore the Risk Assessment Training course →
Mark writes about workplace health & safety, risk assessment and accredited online training for Risk Assessment Training, part of Online CPD Academy.