
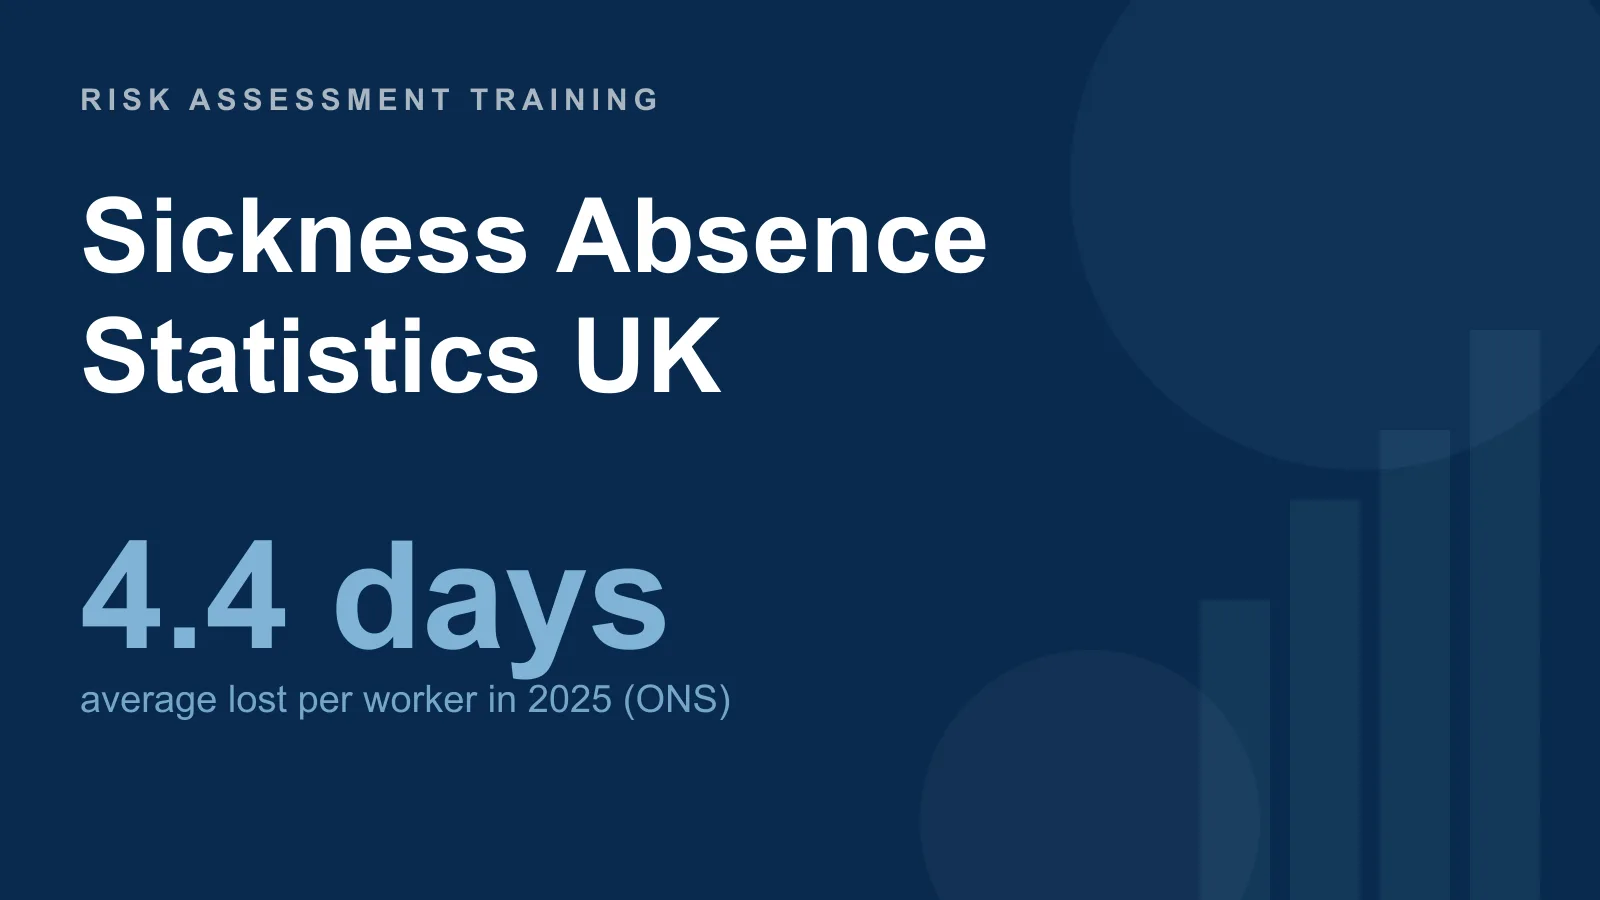
Two official-looking figures for “average sick days per year” circulate in the UK and they disagree by more than double: the Office for National Statistics (ONS) puts it at 4.4 days per worker, while the CIPD’s employer survey reports 9.4 days per employee. Both are correct — they measure different things — and this page reconciles them, then goes into the splits the headline release buries: public versus private sector, part-time versus full-time, occupation, region, age, sex, and per-sector benchmarks from the NHS and the Civil Service. Every figure is drawn from a named source — the ONS labour-market series, the CIPD Health and Wellbeing at Work report, NHS England Digital, GOV.UK and IPPR — with the data period alongside it.
Key facts and figures
- 4.4 days — the average number of working days lost to sickness or injury per worker in 2025, on the ONS labour-force measure.
- 148.8 million working days were lost to sickness or injury across the UK in 2025 (ONS).
- 2.0% — the UK sickness absence rate in 2025, unchanged from 2024 and 0.1 percentage points above the 2019 pre-pandemic level (ONS).
- 9.4 days — the average lost per employee reported by employers in the CIPD 2025 survey, up from 7.8 days in 2023 and 5.8 days pre-pandemic.
- 2.9% vs 1.7% — the public-sector absence rate against the private-sector rate in 2025 (ONS).
- 5.7% — the NHS England sickness absence rate in October 2025, up from 5.4% a year earlier (NHS England Digital).
- 8.2 days — average working days lost per Civil Service staff year to 31 March 2025, up from 7.8 (GOV.UK).
- £30 billion — the estimated rise in the hidden annual cost of employee sickness since 2018 (IPPR).
All figures are the latest available as of July 2026, and this page is updated when new data is released — principally the ONS annual article each May, the CIPD survey each September, NHS England Digital’s monthly release, and the Civil Service report each December.
How many sick days does the average UK worker take per year?
The honest answer is either 4.4 or 9.4 days, depending on which measure you use — and confusing the two is the single most common mistake in absence reporting. On the ONS labour-force measure, an estimated 148.8 million working days were lost to sickness or injury in 2025, an average of 4.4 days per worker. On the CIPD’s employer survey (2025 edition, published 9 September 2025), organisations reported an average of 9.4 days lost per employee — nearly two working weeks.
The two figures diverge for structural reasons, not because one is wrong. The ONS number is derived from the Labour Force Survey: it asks a large representative sample of the whole workforce — including small firms, the self-employed and people who took no time off at all — how many hours they were absent in a reference week, then scales it up. Averaging across everyone, including the majority who took zero days, pulls the figure down. The CIPD number comes from HR records at a self-selected sample of employers, skewed towards larger organisations with formal absence policies and higher recorded absence; it counts calendar-based days per employee within those organisations. As a rule of thumb, treat the ONS 4.4 as the economy-wide labour-force rate and the CIPD 9.4 as the typical figure an HR team will see in a mid-to-large employer’s own records.
Both point the same way over time. The CIPD figure has climbed from 5.8 days before the pandemic to 7.8 in 2023 and 9.4 in 2025, while the ONS rate has settled at 2.0%, just above its 2019 level. For a benchmark you can defend, cite the measure that matches your context and state which one it is.
What is the UK sickness absence rate?
The UK sickness absence rate was 2.0% in 2025, unchanged from 2024 and 0.1 percentage points above the 2019 pre-pandemic level of 1.9%, according to the ONS. The rate is the share of scheduled working hours lost to sickness across the workforce — a cleaner cross-group comparator than raw day counts, because it adjusts for how many hours each group is contracted to work.
That 2.0% headline sits well below the pandemic-era peak. Absence spiked to 2.6% in 2022 on the back of respiratory illness and long-term conditions, then eased back. The stability of the rate since — flat at 2.0% for two consecutive years — is the reason commentators describe UK sickness absence as having returned to a post-pandemic plateau rather than continuing to climb, even as the employer-reported day count in the CIPD series keeps rising.
Are public sector workers off sick more than private sector?
Yes — public-sector absence ran at 2.9% in 2025 against 1.7% in the private sector, a gap of 1.2 percentage points on the ONS measure. The public-sector rate has consistently exceeded the private-sector rate for as long as the series has been split, and the difference is not simply a matter of generous sick pay.
Several structural factors drive the gap. Public-sector workforces are older on average, more likely to be in physically or emotionally demanding front-line roles (nursing, teaching, care, emergency services), more heavily unionised with occupational sick-pay entitlements, and more likely to have formal absence-recording systems that capture every day off. Larger organisations of any kind record higher absence than small firms, and the public sector is dominated by very large employers. The composition of the workforce, in other words, explains much of the difference before you reach any question of culture.
How does sickness absence vary by worker group?
The absence rate varies sharply by who is working, and the ONS 2025 data lets you benchmark most of the common splits. Part-time workers had a 2.8% absence rate against 1.9% for full-time workers. Women recorded 2.4% against 1.7% for men. Absence rises steadily with age, from 1.3% for 16–24-year-olds to 3.3% for those aged 65 and over. And the single biggest divide is health status: workers with a long-term health condition had a 4.0% absence rate, four times the 1.0% rate for those without one.
| Group (2025) | Absence rate | Comparator |
|---|---|---|
| All UK workers | 2.0% | Baseline |
| Public sector | 2.9% | Private sector 1.7% |
| Part-time | 2.8% | Full-time 1.9% |
| Women | 2.4% | Men 1.7% |
| Aged 16–24 | 1.3% | Aged 65+ 3.3% |
| Long-term health condition | 4.0% | No condition 1.0% |
| Highest occupation (process, plant & machine operatives) | 3.3% | Managers & senior officials 1.0% |
| Highest region (Yorkshire & The Humber) | 2.4% | London 1.5% |
Source: ONS, Sickness absence in the UK labour market, 2025 reference year.
By occupation, process, plant and machine operatives had the highest 2025 absence rate at 3.3%, while managers, directors and senior officials had the lowest at 1.0%. By region, Yorkshire and The Humber was highest at 2.4% and London lowest at 1.5% — a pattern that broadly tracks the age profile and occupational mix of each area’s workforce rather than reflecting anything intrinsic to the geography.
What are the most common reasons for sickness absence?
Minor illnesses — coughs, colds and similar short-term complaints — were the most common reason for absence in 2025 at 30.4% of all days lost, according to the ONS. Musculoskeletal problems (back, neck and limb conditions) accounted for 14.6%, and mental health conditions for 8.9%. The remainder is spread across “other” conditions, respiratory and heart problems, and unspecified causes.
The ranking changes when you look at long-term absence rather than total days. The CIPD’s 2025 survey found mental ill health was the leading cause of long-term absence, cited by 41% of organisations, ahead of musculoskeletal injury (31%) and other chronic conditions (30%). Vendor absence-management analysis of employer records echoes the split, with minor illness dominating short spells and mental health and musculoskeletal conditions dominating the long, costly ones. The causes of that mental-health absence — and how a stress risk assessment addresses them — sit outside the scope of this page; see our work-related stress statistics and stress risk assessment guide.
Which UK sector has the highest sickness absence rate?
Within the public sector, the NHS carries one of the highest recorded rates of any large UK employer — 5.7% in October 2025, up from 5.4% in October 2024, on NHS England Digital’s monthly measure. That is well above the 2.9% public-sector average and nearly three times the private-sector rate. The single largest cause was anxiety, stress, depression and other psychiatric illness, at 757,400 full-time-equivalent days lost and 28.1% of all NHS sickness in December 2025.
The rate varies widely by NHS staff group. Ambulance trusts recorded the highest sickness rate at 6.6% in July 2025, reflecting the physical and psychological demands of front-line emergency work, while hospital and community health service (HCHS) doctors were among the lowest at around 2%. On the ONS occupational split, process, plant and machine operatives top the private-sector-heavy occupations at 3.3%. In short: manual and front-line emergency roles sit at the top, professional and managerial roles at the bottom, and the NHS is the standout high-absence employer.
What is the Civil Service sickness absence rate?
Civil Service average working days lost rose to 8.2 days per staff year in the year to 31 March 2025, up from 7.8 days a year earlier, according to the annual GOV.UK report published in December 2025. That places the Civil Service between the ONS labour-force average and the CIPD employer figure, and above the whole-economy public-sector rate once expressed in days.
Mental ill-health was the top cause of long-term Civil Service absence, accounting for 47.1% of long-term days lost — a higher share than the NHS’s psychiatric-illness figure and consistent with the CIPD’s finding that mental health now leads long-term absence across UK employers generally. The Civil Service report is one of the more granular public benchmarks available, broken down by department, grade and absence type, which is why it is widely cited by HR teams building comparators for large office-based workforces.
How much does sickness absence cost UK employers?
The hidden annual cost of employee sickness has risen by an estimated £30 billion a year since 2018, according to the Institute for Public Policy Research (IPPR) in its 2024 analysis. Strikingly, the bulk of that increase is not extra sick days: IPPR attributes around £25 billion to lost productivity from people working while unwell (presenteeism) and only about £5 billion to additional absence itself.
That framing matters for how employers respond. If most of the growing cost comes from reduced productivity among people who are at work but not fully well, then absence-reduction targets alone miss the point — the larger prize is supporting recovery and managing workload so that people are neither pushed to work when they shouldn’t, nor left unsupported when they return. The direct cost of the days lost themselves, on the CIPD’s 9.4-days-per-employee figure, is real but is only part of the total burden the IPPR model captures.
Frequently asked questions
How many sick days does the average UK worker take per year?
It depends on the measure. The ONS puts it at 4.4 days per worker in 2025 (a whole-workforce labour-force average that includes everyone who took no time off), while the CIPD’s 2025 employer survey reports 9.4 days per employee (drawn from HR records at mostly larger organisations). Neither is wrong — the ONS figure is the economy-wide rate; the CIPD figure is closer to what a mid-to-large employer sees in its own absence data.
Which UK sector has the highest sickness absence rate?
The public sector as a whole (2.9% in 2025) runs above the private sector (1.7%), and within it the NHS is the standout, at 5.7% in October 2025. Ambulance trusts recorded the highest NHS rate at 6.6% in July 2025. On the ONS occupational split, process, plant and machine operatives had the highest rate of any occupation at 3.3%.
Are public sector workers off sick more than private sector?
Yes. Public-sector absence was 2.9% in 2025 against 1.7% in the private sector on the ONS measure — a gap of 1.2 percentage points. The difference is largely structural: older workforces, more front-line and physically demanding roles, larger organisations and more complete absence recording, rather than culture alone.
How much does sickness absence cost UK employers?
The IPPR estimates the hidden annual cost of employee sickness has risen by around £30 billion a year since 2018, of which roughly £25 billion is lost productivity from working while unwell and only about £5 billion is extra sick days. The rise in cost is therefore driven far more by presenteeism than by absence itself.
How often are these statistics updated?
The ONS publishes its sickness absence article each May (the 2025 reference-year data was published on 1 May 2026), the CIPD survey appears each September, NHS England Digital releases monthly figures, and the Civil Service report is published each December. This page is reviewed against each release, and figures here are the latest available as of July 2026.
Related guides
- Work-Related Stress Statistics UK: HSE Facts & Data
- Risk Assessment Statistics UK: Compliance Facts & Data
- HSE Enforcement Statistics UK: Fines, Prosecutions & Notices
- Stress risk assessment: the HSE Management Standards explained
- Risk assessment examples: three worked examples for UK workplaces
Sources & references
- Office for National Statistics — Sickness absence in the UK labour market, 2025
- Office for National Statistics — Sickness absence in the labour market dataset (all splits, 2025 edition)
- CIPD / Simplyhealth — Health and Wellbeing at Work Report 2025
- NHS England Digital — NHS Sickness Absence Rates (monthly)
- GOV.UK — Civil Service sickness absence 2025 report
- IPPR — Hidden annual cost of employee sickness is up £30 billion since 2018
- The Access Group — UK Sick Leave Report 2024–25 (most common reasons)
Absence tracks back to hazards left unmanaged — train your team to carry out suitable and sufficient risk assessments.
Explore the Risk Assessment Training course →
Mark writes about workplace health & safety, risk assessment and accredited online training for Risk Assessment Training, part of Online CPD Academy.